Historical PM2.5 records
New York's worst air quality days
Based on the available regulatory-monitor record since 1999, June 7, 2023 ranks as New York's most severe daily PM2.5 day: 203.5 µg/m³ (AQI 278, very unhealthy), about 9.3 cigarettes in a day.
- Daily rank
- #1
- Period of record
- Since 1999
- Peak daily PM2.5
- 203.5 µg/m³
- About
- 9.3 cigarettes
- Latest event
- 3 days, July 2026
- Status
- Finalized
Current conditions on the smoke map → Data through Jul 18, 2026 · page built August 26, 2026
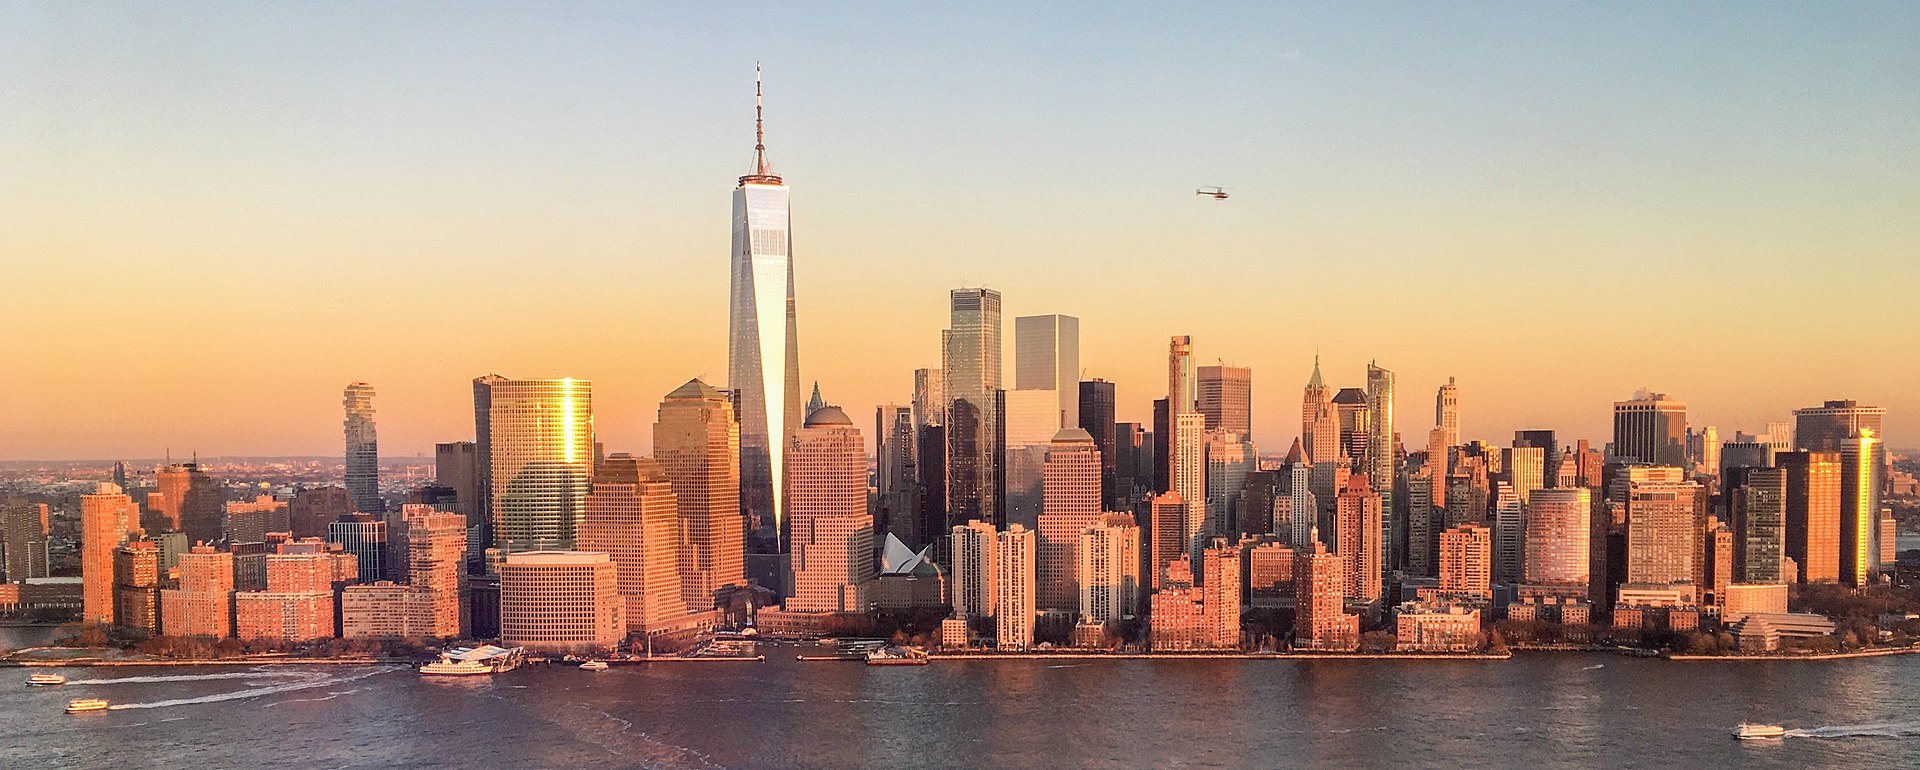
Photo: Fred Hsu on en.wikipedia (CC BY-SA 4.0)How this is measured sources, the daily measure, and what this ranking is not
Source. Daily PM2.5 from the U.S. EPA Air Quality System (AQS) , back to 1999, across 59 EPA monitors in the New York-Newark-Jersey City, NY-NJ-PA metro area (CBSA). Days after May 31, 2026 are preliminary AirNow readings, marked provisional, and re-rank once EPA certifies them (usually the following spring).
The daily measure. "Worst area" is the metro's highest credible monitor each day, with lone bad-monitor spikes dropped (the raw single-monitor max before that filter is in the data but not charted). "Metro average" averages every monitor. The unit choice re-reads the same value as µg/m³, cigarette-equivalents (PM2.5 ÷ 22, Berkeley Earth, an illustration rather than a medical reading), or the EPA 2024 PM2.5 AQI.
Official AQI. EPA's reported metro AQI uses the single worst monitor of any pollutant, so it can run higher than the values here. The highest official daily AQI among the ranked days is 278 on June 7, 2023 (defining pollutant PM2.5).
What this ranking is not. It does not attribute days to wildfire smoke: a high-PM2.5 day can be dust, fireworks, an inversion, or industry. The wildfire-smoke event ranking below arrives with a published attribution method.
What were New York's worst days?
| Rank | Date | Air event | PM2.5 / cigarettes |
|---|---|---|---|
| #1 | June 7, 20233-day stretch | Wildfire smoke Agency determination | 203.5 µg/m³ · 9.3 cigs |
| #2 | June 8, 2023 | Wildfire smoke Agency determination | 112.6 µg/m³ · 5.1 cigs |
| #3 | July 16, 2026provisional3-day stretch | Wildfire smoke Agency determination | 109.8 µg/m³ · 5.0 cigs |
| #4 | June 6, 2023 | Wildfire smoke Agency determination | 101 µg/m³ · 4.6 cigs |
| #5 | July 7, 20022-day stretch | Wildfire smoke EPA monitor flag | 86.8 µg/m³ · 3.9 cigs |
| #6 | October 27, 20002-day stretch | Regional secondary PM Possible | 77.7 µg/m³ · 3.5 cigs |
| #7 | June 30, 2023 | Wildfire smoke Agency determination | 66.7 µg/m³ · 3.0 cigs |
| #8 | July 18, 2026provisional | Wildfire smoke Agency determination | 65.4 µg/m³ · 3.0 cigs |
| #9 | October 26, 2000 | Regional secondary PM Possible | 63.8 µg/m³ · 2.9 cigs |
| #10 | July 17, 2026provisional | Wildfire smoke Agency determination | 63.2 µg/m³ · 2.9 cigs |
| #11 | July 20, 2021 | Wildfire smoke EPA monitor flag | 62.1 µg/m³ · 2.8 cigs |
| #12 | July 8, 2002 | Wildfire smoke EPA monitor flag | 59 µg/m³ · 2.7 cigs |
| #13 | June 27, 2003 | Mixed causes Possible | 58.9 µg/m³ · 2.7 cigs |
| #14 | October 9, 2003 | Temperature inversion Possible | 58.1 µg/m³ · 2.6 cigs |
| #15 | July 22, 2004 | Wildfire smoke EPA monitor flag | 56.4 µg/m³ · 2.6 cigs |
Days marked provisional are preliminary AirNow readings after May 31, 2026, the latest date EPA has certified for New York; they may shift once finalized.
What caused New York's worst days?
The air-event catalog has named 14 episodes affecting New York, each resolved to a cause only where retained evidence supports it: EPA monitor qualifiers, NWS alerts, agency statements, and reporting. The ranking above stays cause-neutral; this is where the causes live.
- Wildfire smoke July 15–20, 2026 Great Lakes and eastern U.S. wildfire-smoke episode
- Wildfire smoke 2023 late-June Canadian wildfire-smoke episode
- Wildfire smoke 2023 early-June Canadian wildfire-smoke episode
- Wildfire smoke 2021-07-20 11-area wildfire-smoke episode
- Stagnant pollution mixture 2009-11-09 New York-Newark-Jersey City, NY-NJ-PA stagnant mixed-pollution episode
- Regional secondary PM 2007-08-16 New York-Newark-Jersey City, NY-NJ-PA regional secondary-particle pollution episode
8 more, plus every named episode and its evidence is in the air events.
New York air season · summer so far, through July 27
New York's summer is the 14th-worst of 27 on record.
The summer season in every year since 1999, measured over the same window, June 1 to July 27, so each is compared at the same point. All fine particulate the metro's monitors recorded, from every source.
Where 2026 stands
The race, summer by summer
Every summer on record
| Rank | Season | Cigs | Average µg/m³ | Worst day | Unhealthy days | Coverage |
|---|---|---|---|---|---|---|
| 1 | 2023 | 65.2 cig · 25.2 µg/m³ avg | 25.2 | 203.5 | 5 | 100% |
| 2 | 2002 | 61.6 cig · 23.8 µg/m³ avg | 23.8 | 86.8 | 2 | 100% |
| 3 | 2003 | 55.3 cig · 21.3 µg/m³ avg | 21.3 | 58.9 | 1 | 100% |
| 4 | 2008 | 53.9 cig · 20.8 µg/m³ avg | 20.8 | 37.6 | 0 | 100% |
| 5 | 2005 | 53.2 cig · 20.5 µg/m³ avg | 20.5 | 51.4 | 0 | 100% |
| 6 | 2000 | 51.7 cig · 20 µg/m³ avg | 20 | 45 | 0 | 100% |
| 7 | 2006 | 51.4 cig · 19.9 µg/m³ avg | 19.9 | 49 | 0 | 100% |
| 8 | 2004 | 51.1 cig · 19.7 µg/m³ avg | 19.7 | 56.4 | 1 | 100% |
| 9 | 2001 | 48.9 cig · 18.9 µg/m³ avg | 18.9 | 54.2 | 0 | 100% |
| 10 | 2007 | 47.8 cig · 18.5 µg/m³ avg | 18.5 | 46.8 | 0 | 100% |
| 11 | 2011 | 47.0 cig · 18.1 µg/m³ avg | 18.1 | 40.8 | 0 | 100% |
| 12 | 2010 | 42.0 cig · 16.2 µg/m³ avg | 16.2 | 41 | 0 | 100% |
| 13 | 2021 | 40.3 cig · 15.6 µg/m³ avg | 15.6 | 62.1 | 1 | 100% |
| 14 | 2026 | 38.2 cig · 14.7 µg/m³ avg | 14.7 | 109.8 | 3 | 100% |
| 15 | 2017 | 36.8 cig · 14.2 µg/m³ avg | 14.2 | 24.4 | 0 | 100% |
| 16 | 2025 | 36.7 cig · 14.2 µg/m³ avg | 14.2 | 39.7 | 0 | 100% |
| 17 | 2018 | 35.4 cig · 13.7 µg/m³ avg | 13.7 | 30.1 | 0 | 100% |
| 18 | 2019 | 34.3 cig · 13.2 µg/m³ avg | 13.2 | 27.4 | 0 | 100% |
| 19 | 2015 | 33.4 cig · 12.9 µg/m³ avg | 12.9 | 29.3 | 0 | 100% |
| 20 | 2016 | 33.3 cig · 12.9 µg/m³ avg | 12.9 | 28.8 | 0 | 100% |
| 21 | 2009 | 33.3 cig · 12.9 µg/m³ avg | 12.9 | 29.3 | 0 | 100% |
| 22 | 2012 | 33.3 cig · 12.9 µg/m³ avg | 12.9 | 31.9 | 0 | 100% |
| 23 | 2013 | 33.0 cig · 12.7 µg/m³ avg | 12.7 | 31.2 | 0 | 100% |
| 24 | 2014 | 32.9 cig · 12.7 µg/m³ avg | 12.7 | 23 | 0 | 100% |
| 25 | 2024 | 30.5 cig · 11.8 µg/m³ avg | 11.8 | 45.6 | 0 | 100% |
| 26 | 2022 | 30.3 cig · 11.7 µg/m³ avg | 11.7 | 24.1 | 0 | 100% |
| 27 | 2020 | 30.2 cig · 11.7 µg/m³ avg | 11.7 | 26.1 | 0 | 100% |
What this measures, and what it does not
Each bar is the sum of New York's robust metro daily PM2.5 readings across the summer season through July 27, in µg/m³-days, divided by 22 µg/m³ to give cigarette-equivalents. Earlier seasons are cut at the same point in the season, so this is like-for-like rather than full-season totals. The cigarette figure is an illustration of exposure, not a medical equivalence.
It counts all fine particulate the monitors recorded, whatever produced it: wildfire smoke, traffic, industry, fireworks. It is not a smoke-only measure. The documented smoke events shown alongside explain particular spikes; they do not define the ranking, and that catalog only begins in .
Context for reading the ranking: regional fine-particulate levels have fallen substantially since the early 2000s, which is why seasons from that era rank high on season totals while recent seasons rank high on single-day peaks.
A season is ranked only where monitors reported on at least 60% of the window's days, since below that a low total would reflect missing instruments rather than clean air. Excluded on those grounds: 1999. Readings for 2026 after the certified EPA archive are provisional AirNow values and may be revised.
How does it compare?
The record is 81% higher than the next-worst day: 203.5 µg/m³ (June 7, 2023) against 112.6 µg/m³ (June 8, 2023).
How unusual is air like this?
Every measured day near New York, by daily PM2.5; the record stands far out on the right. 220 days at "unhealthy for sensitive groups" or worse, 16 at "unhealthy", 1 at "very unhealthy" (2024 EPA thresholds, across 9,909 measured days).
Year by year (1999–2026)
Worst single day each year, by the selected measure.
Why did reported numbers differ?
During a major event, AirNow, weather apps, news reports, and neighborhood monitors can all show different figures at the same moment. All of them can be right:
- Concentration vs AQI. µg/m³ is the measurement; AQI is a 0 to 500 index derived from it. "330 µg/m³" and "AQI 500" can describe the same air.
- Hourly vs NowCast vs daily. An hourly peak, the NowCast rolling estimate apps display, and the full-day average answer different questions; this page ranks full days.
- One monitor vs a composite. A single sensor can read far above or below a citywide figure. The measure toggle above shows both framings.
- Live vs certified. Real-time feeds get corrected when EPA certifies data months later, which is why recent days here carry a provisional label.
What about indoors?
Citywide monitors can tell you what happened outside. They cannot tell you what happened inside a particular home, school, or facility: filtration, ventilation, and building operation decide that. During and after days like the ones above, outdoor particles become an indoor load question.
Check current conditions and the next clean-air window → Estimate recent filter load where you are →
Common questions
- What was the worst air-quality day in New York?
- June 7, 2023, when daily PM2.5 reached 203.5 µg/m³ (AQI 278), about 9.3 cigarette-equivalents. It ranks first of 9,909 monitored days since 1999.
- What is the highest AQI recorded in New York?
- On the worst day, the daily PM2.5 AQI reached 278 (Very unhealthy). EPA's official metro AQI, which uses the single worst monitor of any pollutant, peaked at 278 on June 7, 2023.
- Were these days caused by wildfire smoke?
- This page ranks measured PM2.5 without assigning a cause: a high day can be smoke, fireworks, dust, an inversion, or industry. A separate wildfire-smoke event ranking, using a published attribution method with its version disclosed, is the next layer of this catalog.
- How often does New York get air this bad?
- Rarely. The record sits at the far end of 9,909 measured days; New York averages about one "unhealthy" day every 2 years.
- Why did different apps show different numbers that day?
- Concentration (µg/m³) and AQI are different scales; hourly, NowCast, and daily values answer different questions; a single monitor differs from a citywide composite; and live feeds get revised when EPA certifies data. This page uses the certified daily record, with the provisional tail labeled.
Data and citation
Ranked days for both measures are downloadable, with units and status flags: new-york.csv. Source: U.S. EPA Air Quality System (AQS) daily PM2.5, with preliminary AirNow readings for the uncertified tail. Cite as:
IAQng Air Records: New York, NY-NJ-PA. iaqng.com/records/new-york. Data: U.S. EPA AQS and AirNow. Accessed August 26, 2026.